


Indifference Curve: Consumer Behaviour (Lecture Note for JAMB)
Introduction to Consumer Behaviour
Consumer behaviour (indifference curve and others) is a crucial aspect of economics, as it helps us understand how individuals decide what goods and services to consume. In this lecture, we’ll explore the factors influencing consumer decision-making, including the cardinalist approach, utility, and the law of diminishing marginal utility.
Learning Objectives:
By the end of this lecture, students should be able to:
- Define and explain the concept of utility, including its meaning, types, and importance in consumer decision-making.
- Understand and apply the cardinalist approach to consumer behavior, including its assumptions and limitations.
- Analyze and interpret the relationship between marginal utility and total utility, including the law of diminishing marginal utility.
- Derive and explain the demand curve from the law of diminishing marginal utility.
- Explain and illustrate the concept of consumer’s equilibrium, including the role of marginal utility and price.
- Define and calculate consumer surplus, including its importance in consumer decision-making.
- Understand and apply the concept of indifference curves, including their assumptions, characteristics, and uses in consumer analysis.
- Analyze and interpret the budget line and its relationship to consumer equilibrium.
- Explain and illustrate the income effect and price consumption curve, including their importance in consumer decision-making.
- Apply the concepts learned in this lecture to real-world scenarios and case studies.
Cardinalist Approach
The cardinalist approach assumes that utility can be measured in terms of numbers. This approach was developed by economists such as Jeremy Bentham and Carl Menger. The cardinalist approach is based on the idea that consumers can assign a numerical value to the satisfaction they derive from consuming a good or service.
Assumptions of the Cardinalist Approach
- Utility can be measured: The cardinalist approach assumes that utility can be measured in terms of numbers.
- Utility is additive: The approach assumes that the total utility derived from consuming multiple goods and services is the sum of the utilities derived from each individual good or service.
- Utility is independent: The approach assumes that the utility derived from consuming one good or service is independent of the utility derived from consuming another good or service.
Utility
Utility refers to the satisfaction or pleasure that a consumer derives from consuming a good or service.
Types of Utility
- Form utility: The utility derived from the shape or form of a good or service.
- Place utility: The utility derived from the location of a good or service.
- Time utility: The utility derived from the availability of a good or service at a particular time.
- Possession utility: The utility derived from owning a good or service.
Concept of Utility
The concept of utility is based on the idea that consumers derive satisfaction or pleasure from consuming goods and services. The utility derived from consuming a good or service depends on various factors, including the consumer’s preferences, income, and prices of related goods and services.
Total Utility (TU)
Total Utility refers to the total amount of satisfaction or pleasure a consumer derives from consuming a particular good or service. It is the sum of all the satisfaction or utility obtained from consuming each unit of the good or service.
Marginal Utility (MU)
Marginal Utility, on the other hand, refers to the additional satisfaction or pleasure a consumer derives from consuming one more unit of a good or service. It is the change in total utility that results from consuming one additional unit.
Relationship between Marginal Utility and Total Utility
Marginal utility refers to the additional utility derived from consuming one more unit of a good or service. Total utility, on the other hand, refers to the total satisfaction or pleasure derived from consuming a good or service.
- Marginal Utility (MU): MU = ΔTU / ΔQ, where ΔTU is the change in total utility and ΔQ is the change in quantity consumed.
- Total Utility (TU): TU = ΣMU, where ΣMU is the sum of marginal utilities.
Total Utility and Marginal Utility are connected concepts that help us understand consumer behavior.
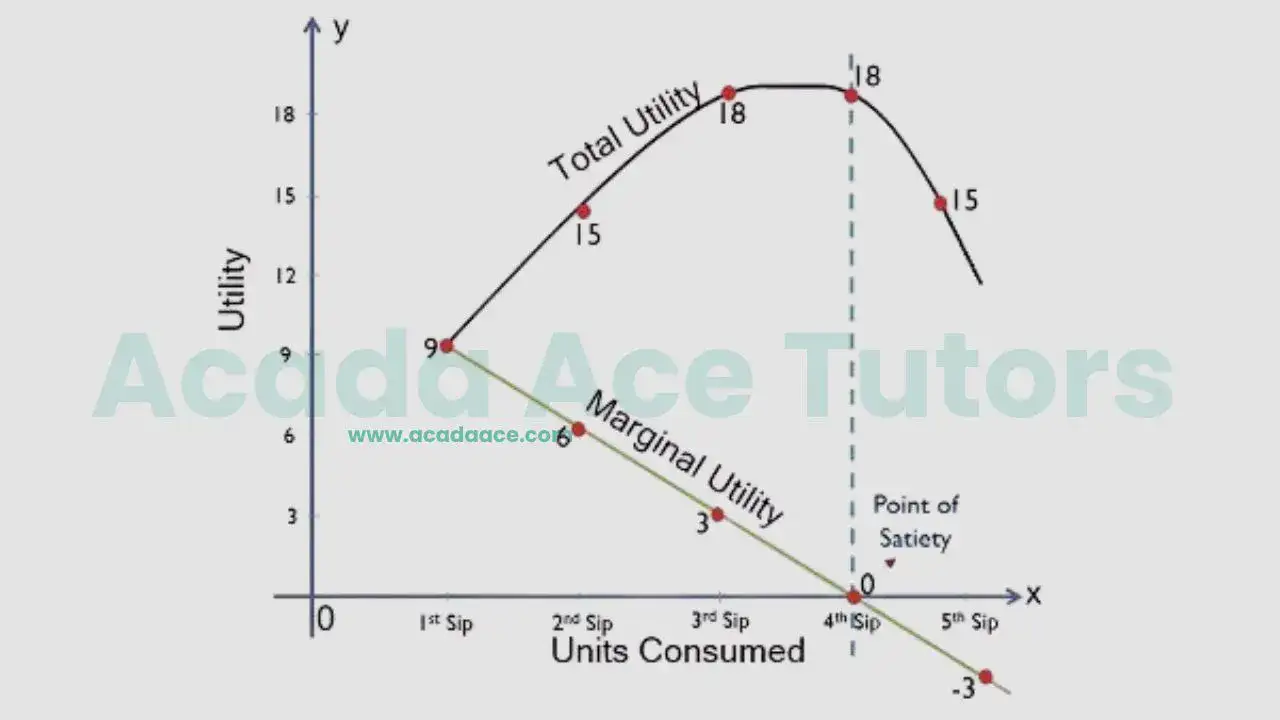
- Marginal Utility decreases: As a consumer buys more units, the extra satisfaction (Marginal Utility) decreases.
- Total Utility increases slowly: Even as Marginal Utility decreases, Total Utility (total satisfaction) still increases, but at a slower rate.
- Maximum satisfaction: When Marginal Utility is zero, Total Utility is at its maximum, and the consumer is most satisfied.
- Negative Marginal Utility: If consumption exceeds the satisfaction point, Marginal Utility becomes negative, and Total Utility starts to decrease.
In Simple Terms:
- Total Utility: total satisfaction from consuming a certain amount
- Marginal Utility: extra satisfaction from consuming one more unit
- Together, they explain why we get less satisfaction from consuming more goods.
Law of Diminishing Marginal Utility
The law of diminishing marginal utility states that as a consumer consumes more units of a good or service, the marginal utility derived from each additional unit decreases.
Derivation of the Demand Curve from Diminishing Marginal Utility
The law of diminishing marginal utility states that as a consumer increases his consumption of a good, the marginal utility he derives from it decreases. By measuring marginal utility in terms of money (MUx = Px), we can determine how much a consumer is willing to pay for a unit of the good. The marginal utility curve is downward sloping, reflecting this decrease in marginal utility. According to the cardinal utility approach, a consumer reaches equilibrium when the marginal utility of a good equals its price (MUx=Px). This equilibrium condition provides the basis for deriving the individual demand curve for a commodity, which was first done by Marshall in the case of a single commodity.
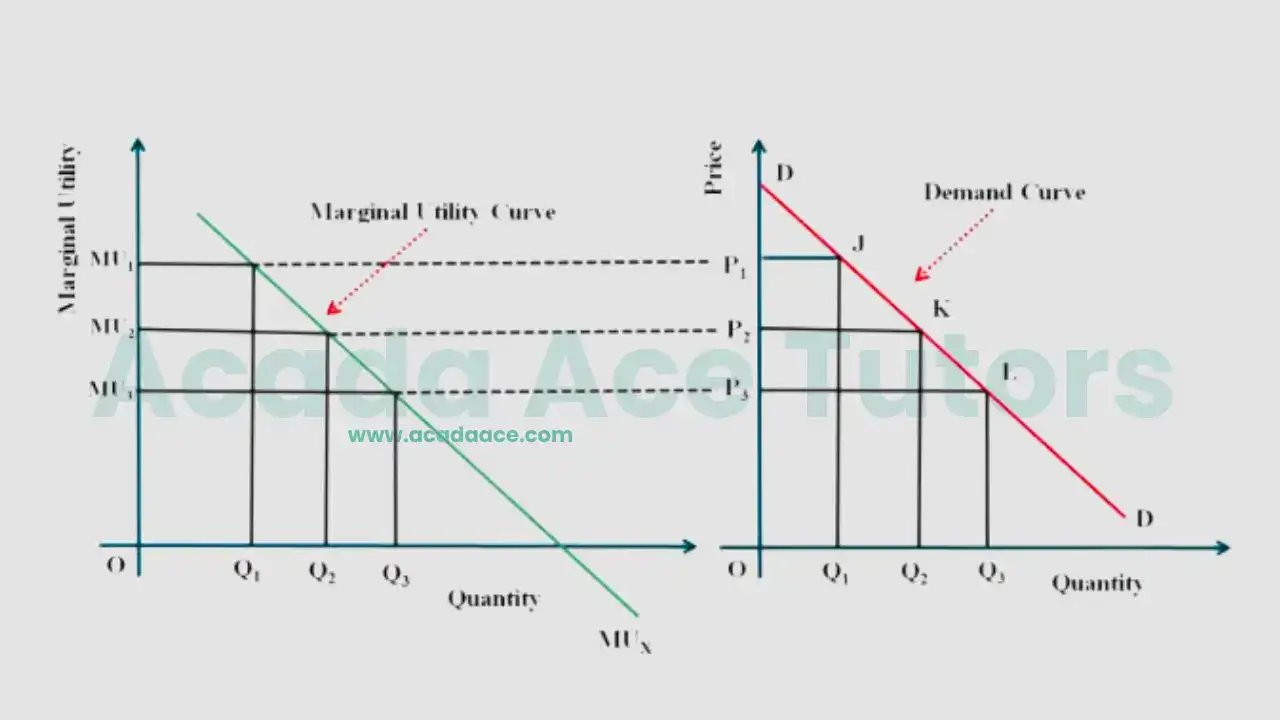
The demand curve can be derived from the law of diminishing marginal utility. As the price of a good or service increases, the marginal utility derived from consuming each additional unit decreases, leading to a decrease in the quantity demanded.
Importance of Diminishing Marginal Utility
The law of diminishing marginal utility is important because it helps us understand why consumers demand more of a good or service at a lower price and less at a higher price.
Consumer’s Equilibrium
Consumer’s equilibrium occurs when the marginal utility derived from consuming a good or service is equal to the price of the good or service.
Related Posts:


")

One commodity: MUx = Px
More than one commodity: MUx/Px = MUy/Py = MUz/Pz
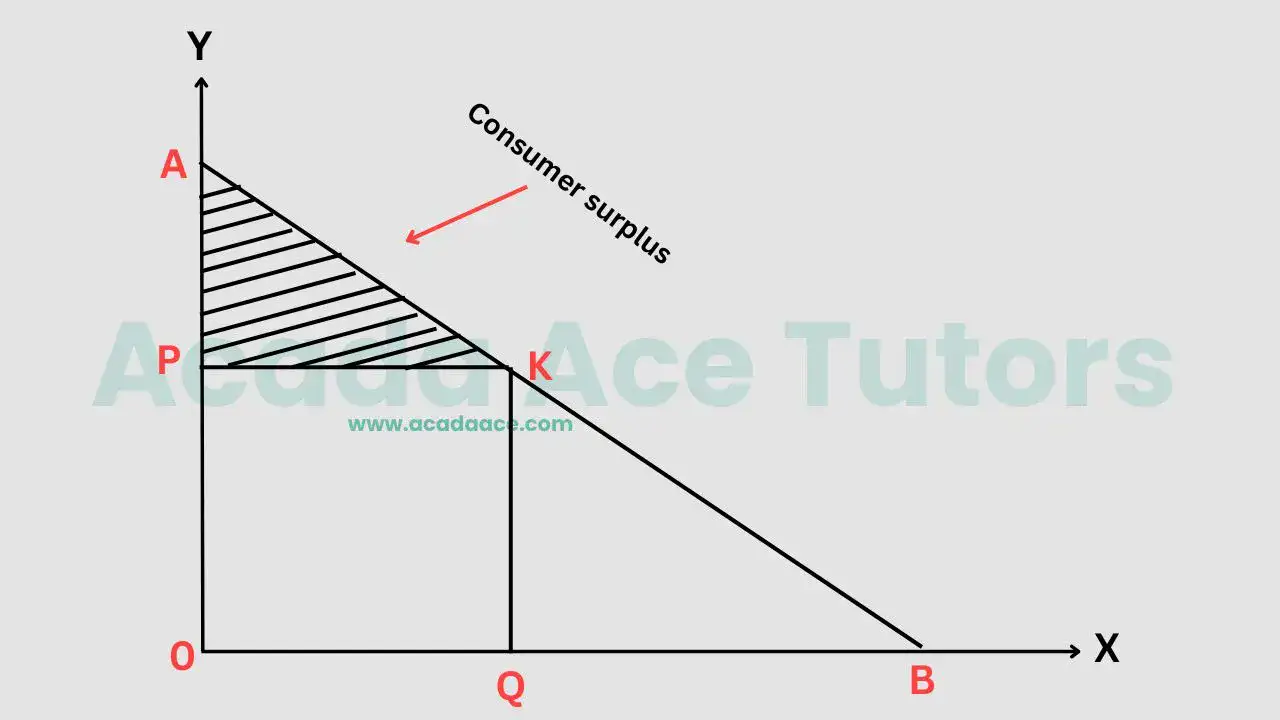
Consumer Surplus
Consumer surplus refers to the difference between the maximum amount that a consumer is willing to pay for a good or service and the actual price paid.
Indifference Curve
An indifference curve is a graphical representation of various combinations of two goods or services that provide the same level of satisfaction or utility to a consumer.
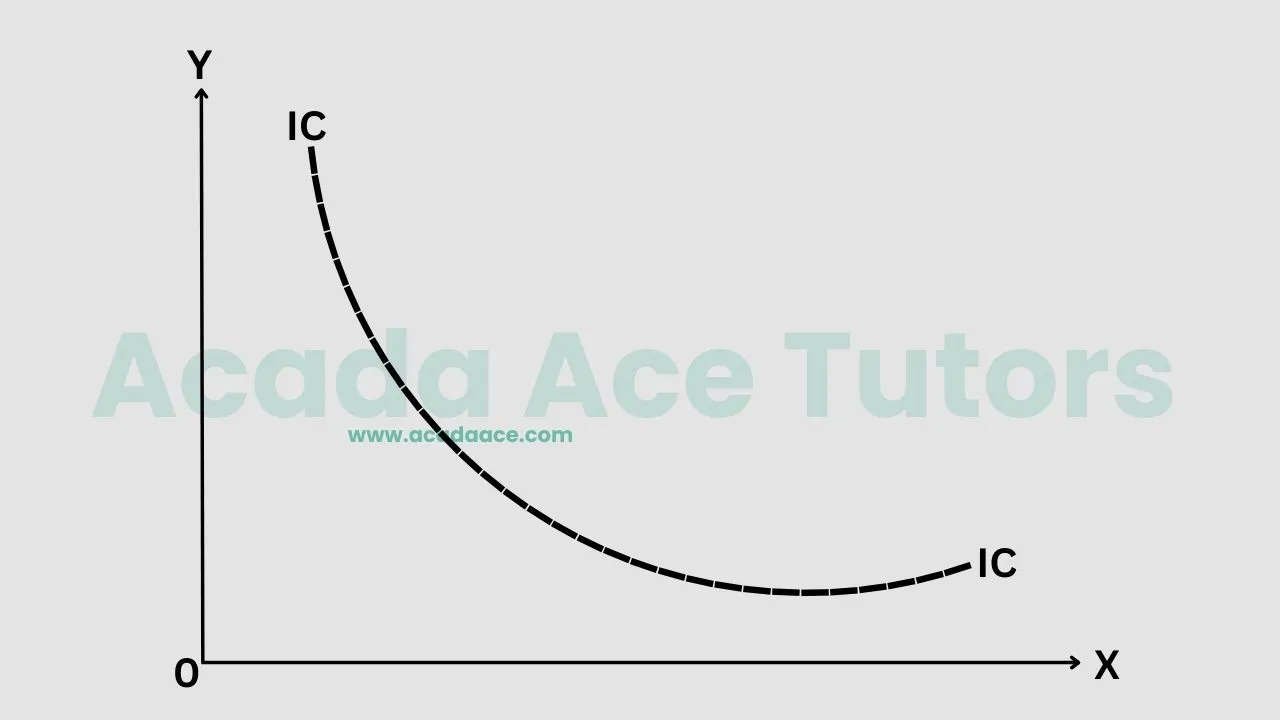
The diagram above represents an indifference curve. It should be noted that the further away an indifference curve is from the point of origin (0), the more satisfaction a consumer derives. Thus, a consumer is willing to go for an indifference curve that is further (right) away from the origin (0). This can be clearly indicated in the indifference map below.
Assumptions of Indifference Curve
- Rationality: Consumers are rational and make informed decisions.
- Transitivity: Consumers prefer one combination of goods or services over another if the first combination provides more satisfaction or utility.
- Completeness: Consumers can rank all possible combinations of goods or services in order of preference.
- Convexity: The indifference curve is convex to the origin, indicating that consumers prefer more of one good or service to less.
Indifference Map
An indifference map is a graphical representation of multiple indifference curves, each representing a different level of satisfaction or utility.
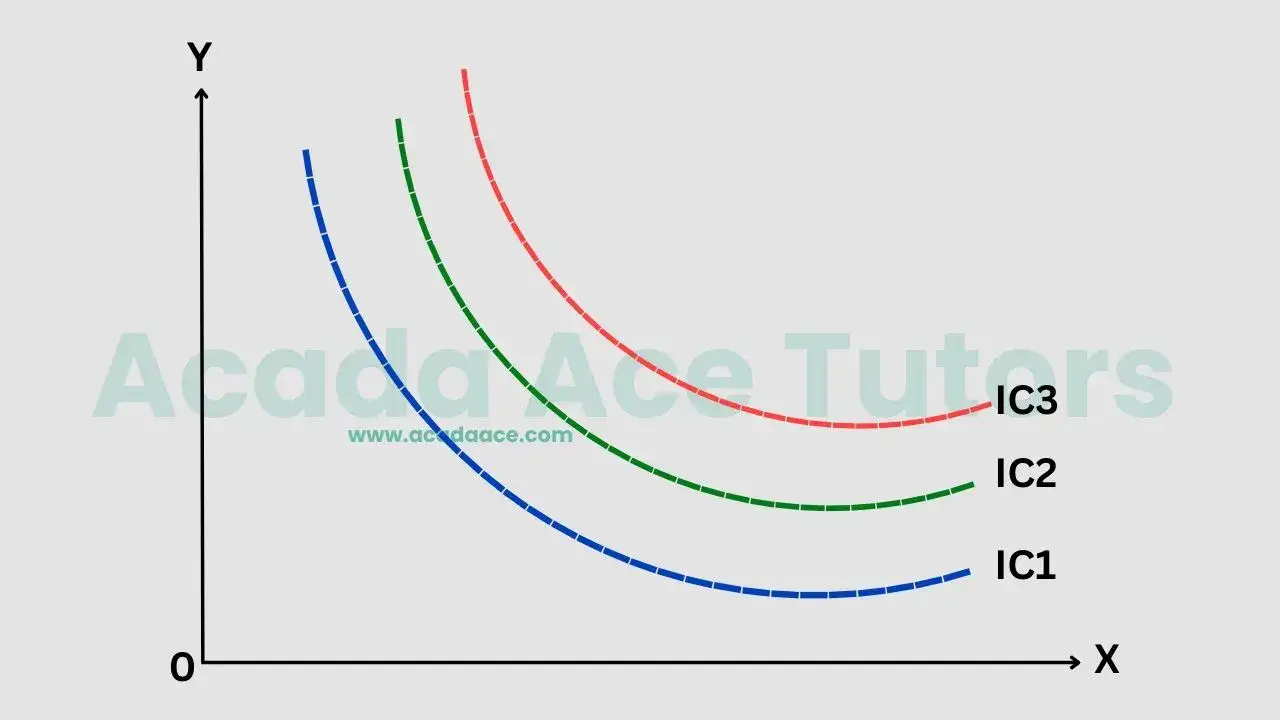
The above diagram is an indifference map. It should be noted that this explains one of the characteristics of an indifference curve, which is transitivity and consistency. The indifference curve 1 IC1 (blue) is the least preferred indifference curve by the consumer because it is the closest to the point of origin. The consumer will prefer IC2 (green) to IC1 because he gets more satisfaction from it. Finally, he prefers IC3 (red)most because, at that point, he derives his highest level of satisfaction. This is the idea of transitivity of choice. Besides, he prefers IC3 to IC1. This explains consistency.
Characteristics of Indifference Curve
- Convexity: The indifference curve is convex to the origin.
- No intersection: Indifference curves do not intersect.
- Higher indifference curves represent higher utility: Indifference curves that are farther away from the origin represent higher levels of satisfaction or utility.
- Transitivity and consistency: The consumer prefers the indifference curve that is further away from the origin on an indifference map
- Two commodities: Two commodities (X and Y) are involved.
Budget Line
A budget line is a graphical representation of various combinations of two goods or services that a consumer can afford to buy given their income and prices of the goods or services
Using Budget Line and Indifference Curve to Explain Consumer Equilibrium
Consumer equilibrium occurs when the budget line is tangent to the indifference curve. This is the point at which the consumer is maximizing their utility given their income and prices of the goods or services.
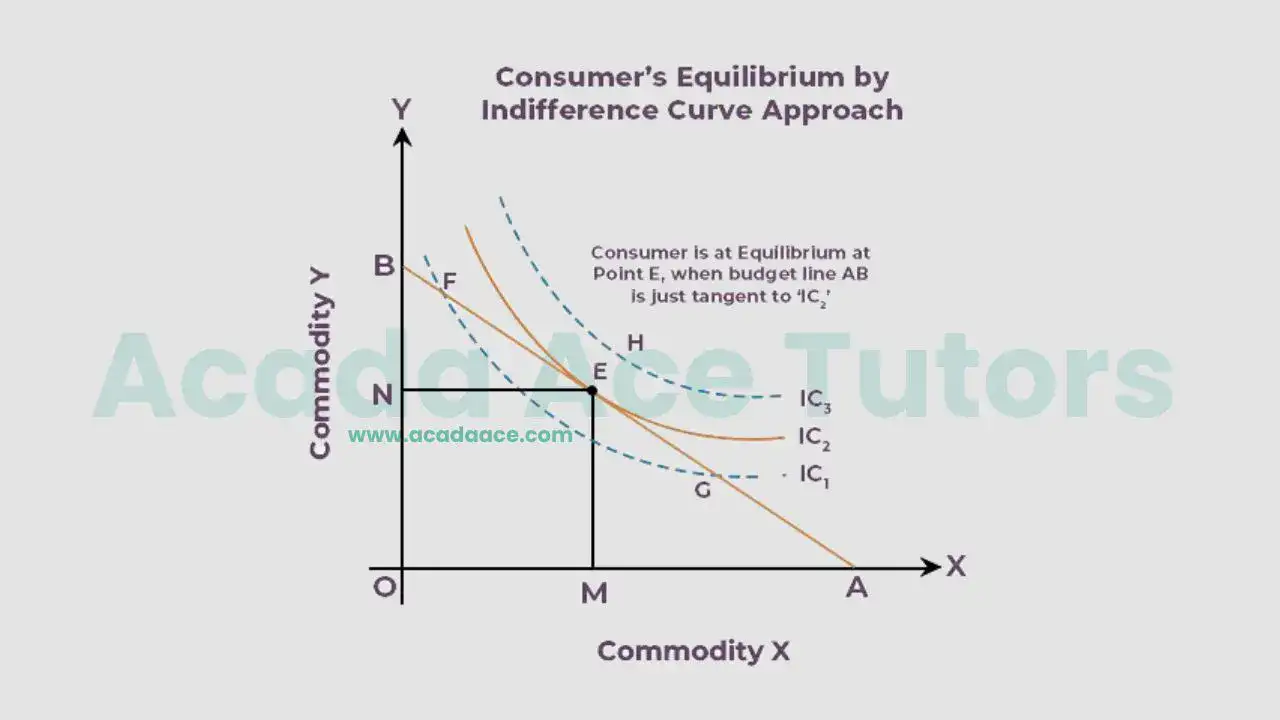
The graph shows three indifference curves (IC1, IC2, and IC3) and a budget line (AB). The highest indifference curve that a consumer can reach with their budget constraint is IC2. The budget line AB is tangent to IC2 at point E, which is the point of equilibrium. At this point, the consumer buys OM quantity of Good X and ON quantity of Good Y.
Points F and G, which lie to the left or right of point E, are on the lower indifference curve IC1, indicating a lower level of satisfaction. Since the budget line can only be tangent to one indifference curve, the consumer maximizes their level of satisfaction at point E. This is where the two conditions of consumer equilibrium are met.
1. Marginal Rate of Substitution (MRS) between Good X and Good Y
The first condition is that the Marginal Rate of Substitution (MRS) between Good X and Good Y is equal to the ratio of their prices (PX/PY), also known as the Market Rate of Exchange (MRE). In other words, the slope of the indifference curve is equal to the slope of the budget line. At point E, the absolute value of the slope of the indifference curve and the price ratio are the same.
2. MRS continuously falls
The consumer cannot attain equilibrium at points to the left or right of E because the MRS is not equal to the price ratio at those points. To the left of E, MRS is greater than PX/PY, and to the right of E, MRS is less than PX/PY. Therefore, equilibrium is only achieved at point E, where MRS equals PX/PY.
The second condition of consumer equilibrium is also met at point E, where MRS is diminishing. This means that IC2 is convex to the origin at this point, indicating that the consumer’s satisfaction decreases as they consume more of one good and less of the other.
Income Effect
The income effect refers to the change in consumption of a good or service resulting from a change in income. An increase in income leads to an increase in consumption of normal goods and a decrease in consumption of inferior goods.
Price Consumption Curve
A price consumption curve is a graphical representation of the relationship between the price of a good or service and the quantity consumed. The curve shows how the quantity consumed changes in response to changes in price.
XII. Budget Constraint and Consumer Equilibrium
The budget constraint is the limitation on a consumer’s spending imposed by their income and prices of goods and services. Consumer equilibrium occurs when the consumer is maximizing their utility subject to their budget constraint.
Key Points to Remember
- Utility: The satisfaction or pleasure derived from consuming a good or service.
- Marginal Utility: The additional utility derived from consuming one more unit of a good or service.
- Total Utility: The total satisfaction or pleasure derived from consuming a good or service.
- Law of Diminishing Marginal Utility: The marginal utility derived from consuming each additional unit of a good or service decreases as the quantity consumed increases.
- Consumer’s Equilibrium: The point at which the marginal utility derived from consuming a good or service is equal to the price of the good or service.
- Indifference Curve: A graphical representation of various combinations of two goods or services that provide the same level of satisfaction or utility to a consumer.
- Budget Line: A graphical representation of various combinations of two goods or services that a consumer can afford to buy given their income and prices of the goods or services.
Practice Questions
- What is the difference between marginal utility and total utility?
- Explain the law of diminishing marginal utility.
- How is the demand curve derived from the law of diminishing marginal utility?
- What is consumer surplus?
- Explain the concept of indifference curve.
I hope this comprehensive lecture note helps you master the key concepts in consumer behavior. Good luck with your JAMB, WAEC, or NECO exams!